In our conceptualization, catchments are composed of five distinct landscape units, each characterised by their functional traits. Three of these units describe different plant covers, including grasslands, shrublands, and forests, while two units represent substrates, namely soil and water bodies. The first three units encompass above-ground biological processes, while soil represents below-ground processes, and water serves as the connection between all units through lateral fluxes, in addition to the processes occurring within the water bodies themselves. There is a sixth hidden unit describing the various forms of lithology, ranging from bedrock to mineral horizons in the soil where weathering occurs.
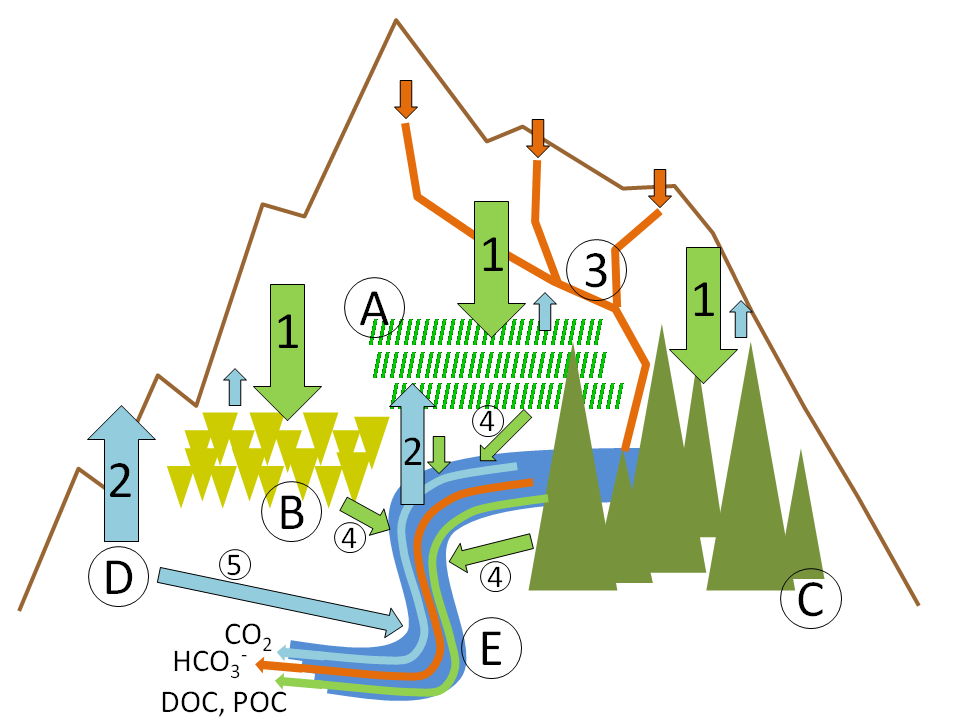
D) soil, E) surface waters. Vertical arrows represent processes affecting net gas exchanges with the
atmosphere: 1) uptake by photosynthesis, 2) respiration, 3) weathering. Oblique arrows represent
lateral fluxes: 4) dissolved and particulate organic matter; 5) CO 2 .
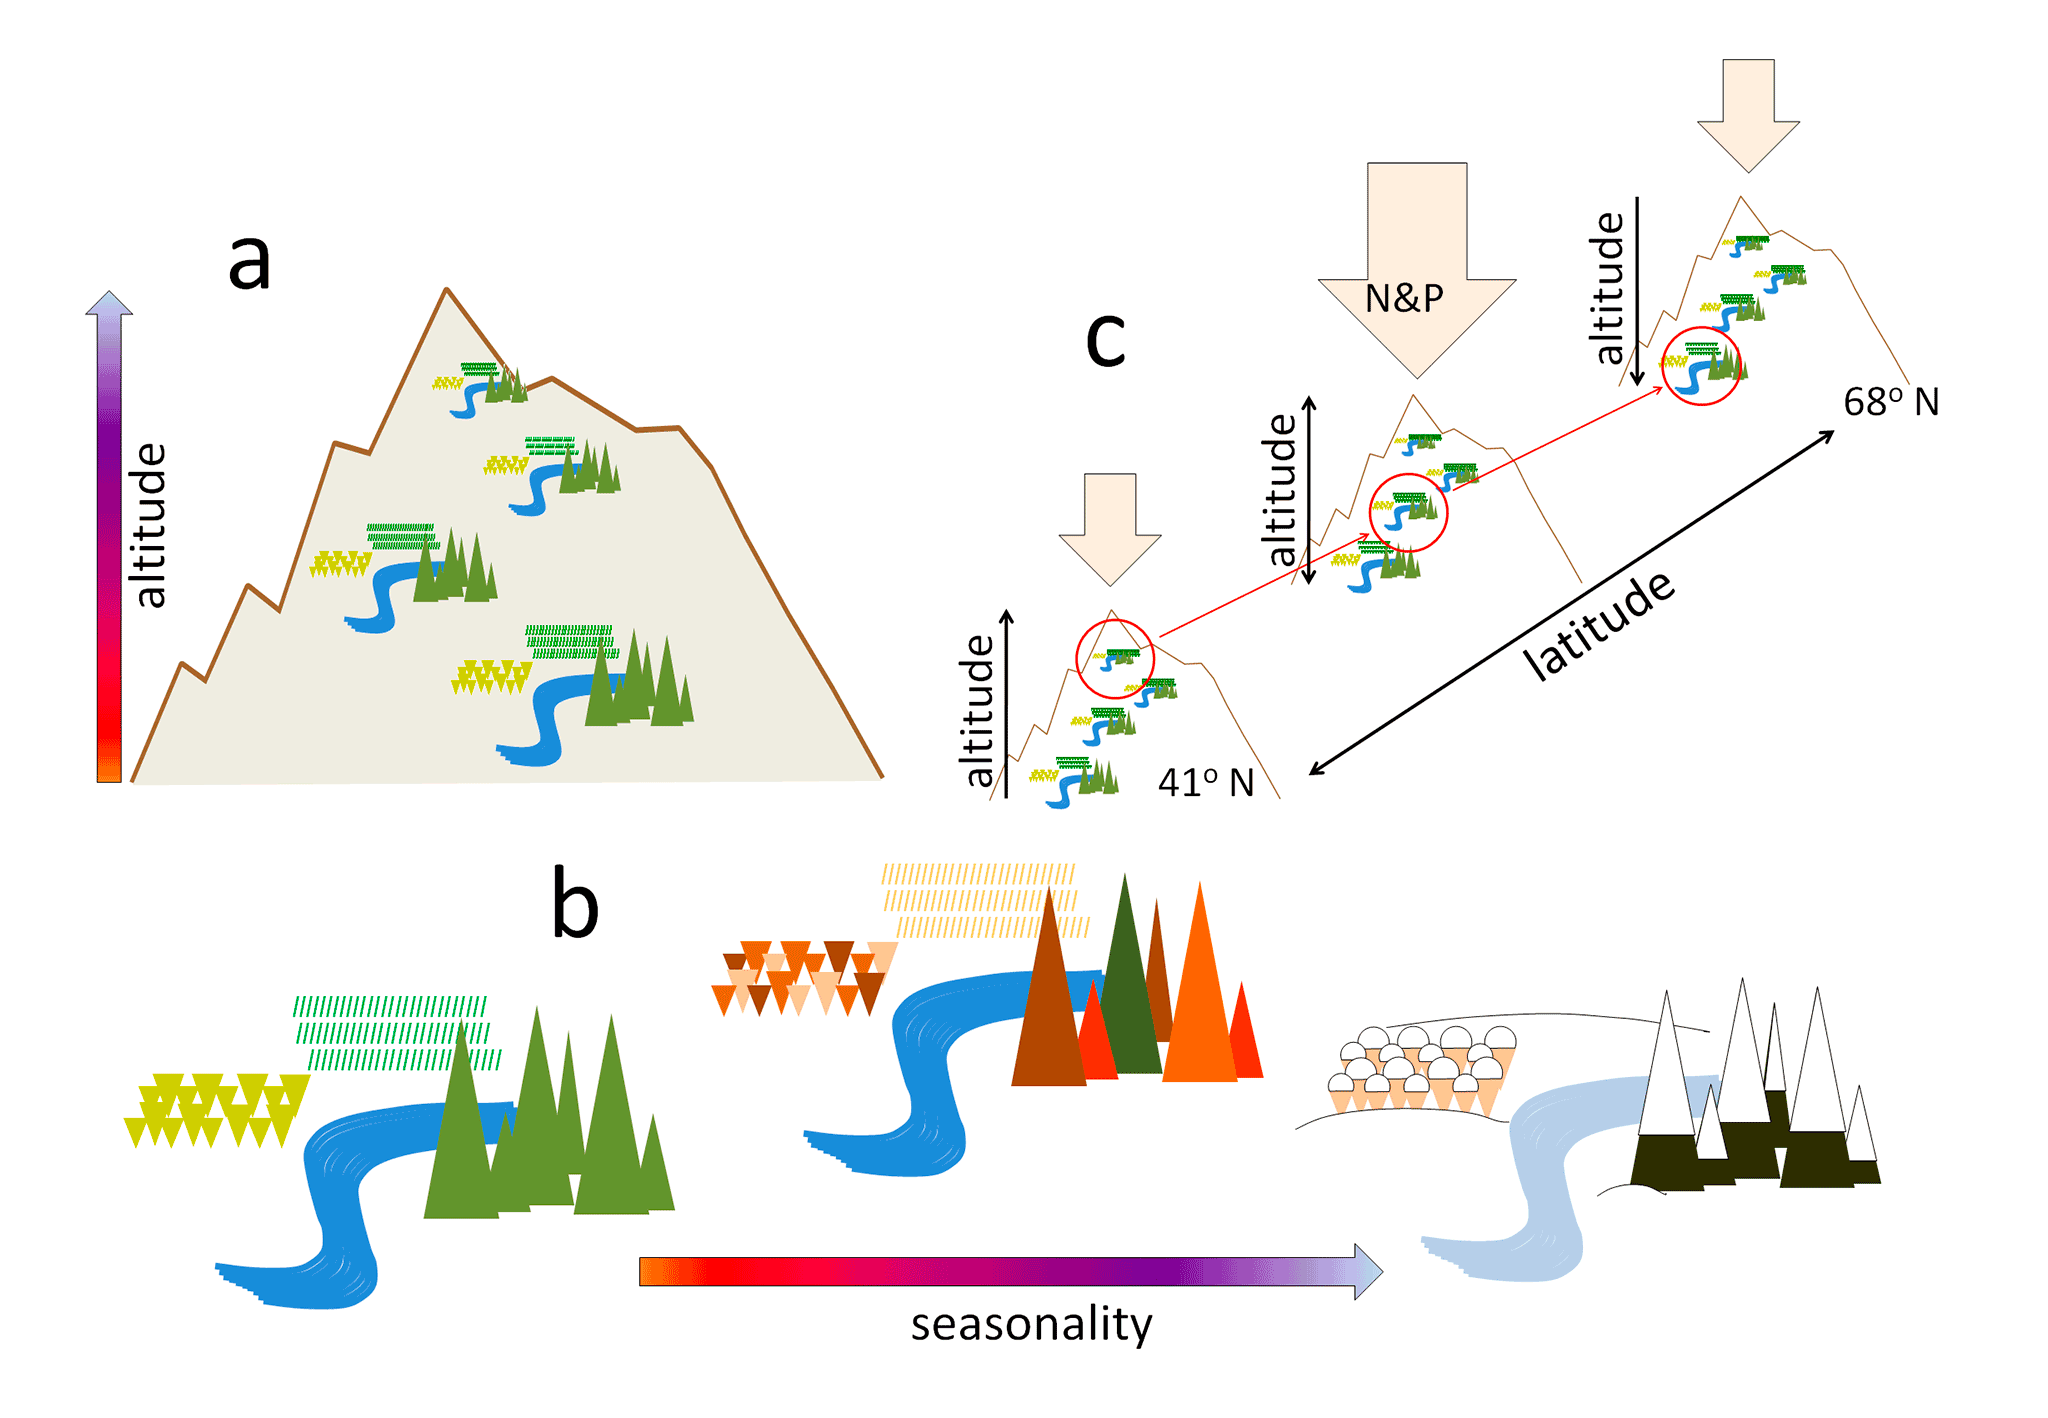
Locally, we observe variations in altitude that, from a climate perspective, serve as substitutes for latitude. These altitude differences enable us to disentangle partially overlapping climate and nutrient deposition gradients. Additionally, the seasonal changes occurring at each site provide diverse scenarios, allowing us to observe the effects of varying meteorological conditions as drivers of GHG fluxes. The catchments included in our study are predominantly pristine sites. However, certain areas within these catchments are subject to different levels of land use, ranging from zones with no land use to areas under increasing degrees of pressure. The identified direct land uses in our catchments include cattle and reindeer herding, mowing, cropland, and forestry. There are also areas indirectly affected by past land use or diseases, such as even-aged, mono-specific reforested plots, transition areas naturally re-colonized by trees after deforestation, and zones affected by bark beetle infestation. To assess the impact of these various land uses, we will compare landscape units with land use to those without land use.
We will generate new data in Work Package 4 (WP4) during a full seasonal cycle by employing newly developed sensors. High-frequency measurements are intended to provide insights into the processes driving change. They will also enable us to capture abrupt and unpredictable events (storms, dust outbreaks, droughts, etc.) that are components of climate change. We will measure the C and GHG fluxes and how they are influenced by the climate, the nutrient deposition and the land use, i.e. the predictors. We will focus on:
- CO2 consumption by weathering: We will conduct mass-balance calculations to estimate average weathering rates for the catchment. This involves measuring precipitation and discharge in the catchment and collecting bulk precipitation and stream water grab samples at the outlet of the catchment to analyse dissolved base cations (Na+, K+, Ca2+ and Mg2+) and dissolved reactive Si (DRSi). Samples will be taken at least monthly.
- Carbon and GHG export: We will quantify the C along with stream discharge, dissolved inorganic and organic carbon (DIC, DOC) will also be determined.
- GHG exchange: We will measure GHG exchange from both water and land. For standing and very slow-running waters, we will use automated floating flux chambers1,2. For faster-running waters we will use acoustic sensors3 to estimate gas transfer velocities combined with in-situ sensors. In parallel, we will deploy sets of sensors in appropriate water profiles to measure gradients and estimate diffusive fluxes and accumulation rates. For land, we will use the same type of chambers as for water. These chambers will integrate the net exchange of soil and small-sized vegetation (grass). They will also be deployed in winter on the snow cover4. Additionally, buried sensors will provide concentration profiles in soils to estimate diffusive fluxes and accumulation rates. For larger size vegetation, we will develop cost-effective systems based on stem and foliage chambers5,6 that will allow us to measure other GHG besides CO2. In some forested catchments, there are EC towers running routinely that will allow us to estimate CO2 exchange. They will also serve as testing and calibration sites for the newly developed systems.
We will focus on the following drivers:
- Climate: We will record meteorological data from our weather stations.
- N and P deposition, and water nutrient status: We will measure nitrate (NO3–), ammonium (NH4+), phosphate (PO32-) and total phosphorus (TP) in the precipitation and running water to estimate N-P deposition and the trophic status of the catchment.
- Land use: We will categorise the landscape units in our catchment according to their land use.
The tasks in WP4 are:
Task 4.1 Analytical Quality Control (AQC) assurance:
The main objective of this task is to ensure method comparability at two levels: 1) between the chemistry laboratories of the 5 partners, and 2) between the existing methods used for measuring gas fluxes and the new high-frequency sensors.
Task 4.2 Water chemistry monitoring:
This task aims to gather the necessary data for calculating weathering rates, estimating C export from the catchment through runoff, and assessing the nutrient status of the catchment and atmospheric load. It encompasses collecting meteorological data, and sampling and analysing runoff water and precipitation.
Task 4.3 Establishing a gas exchange measuring network – existing technologies:
This and the following task aim to develop, deploy, and manage the network of measuring stations. Specifically, this task has two objectives: 1) to evaluate the performance of the new sensors compared to current methods, and 2) to establish a contingency plan in case the new methods do not meet expectations.
Task 4.4 Enhanced measuring network – novel sensor technologies:
Prior to deploying all sensors and fully operating the network, a limited number of sensors will be deployed for functional testing under real field conditions. The performance of these sensors will be compared to the existing methods. Once this testing is complete, the full network of chambers will be deployed and operated throughout a seasonal cycle, including any necessary field re-calibrations. During the snow period, a reduced network will be in operation. If successful, these sensors will continue to operate beyond the project’s duration as a new addition to the existing monitoring programs.
1 Bastviken, D., Sundgren, I., Natchimuthu, S., Reyier, H. & Galfalk, M. Technical Note: Cost-efficient approaches to measure carbon dioxide (CO2) fluxes and concentrations in terrestrial and aquatic environments using mini loggers. Biogeosciences 12, 3849-3859, doi:10.5194/bg-12-3849-2015 (2015).
2 Butturini, A. & Fonollosa, J. Use of metal oxide semiconductor sensors to measure methane in aquatic ecosystems in the presence of cross-interfering compounds. Limnology and Oceanography: Methods 20, 710-720 (2022).
3 Klaus, M., Geibrink, E., Hotchkiss, E. R. & Karlsson, J. Listening to air-water gas exchange in running waters. Limnology and Oceanography: Methods 17, 395-414, doi:https://doi.org/10.1002/lom3.10321 (2019).
4 McDowell, N. G., Marshall, J. D., Hooker, T. D. & Musselman, R. Estimating CO2 flux from snowpacks at three sites in the Rocky Mountains. Tree Physiology 20, 745-753, doi:10.1093/treephys/20.11.745 (2000).
5 Helm, J. et al. Low-cost chamber design for simultaneous CO2 and O2 flux measurements between tree stems and the atmosphere. Tree Physiology 41, 1767-1780, doi:10.1093/treephys/tpab022 (2021).
6 Miyama, T., Kominami, Y., Tamai, K., Nobuhiro, T. & Goto, Y. Automated foliage chamber method for long-term measurement of CO2 flux in the uppermost canopy. Tellus B: Chemical and Physical Meteorology 55, 322-330, doi:10.3402/tellusb.v55i2.16692 (2003).